What scenarios do we show?
Climate change is complex, especially at the regional level. In order to estimate the changes in temperature and precipitation and their consequences, the Helmholtz Climate Research Center Gerics and the German Weather Service have developed extensive models, which we have used in this research.
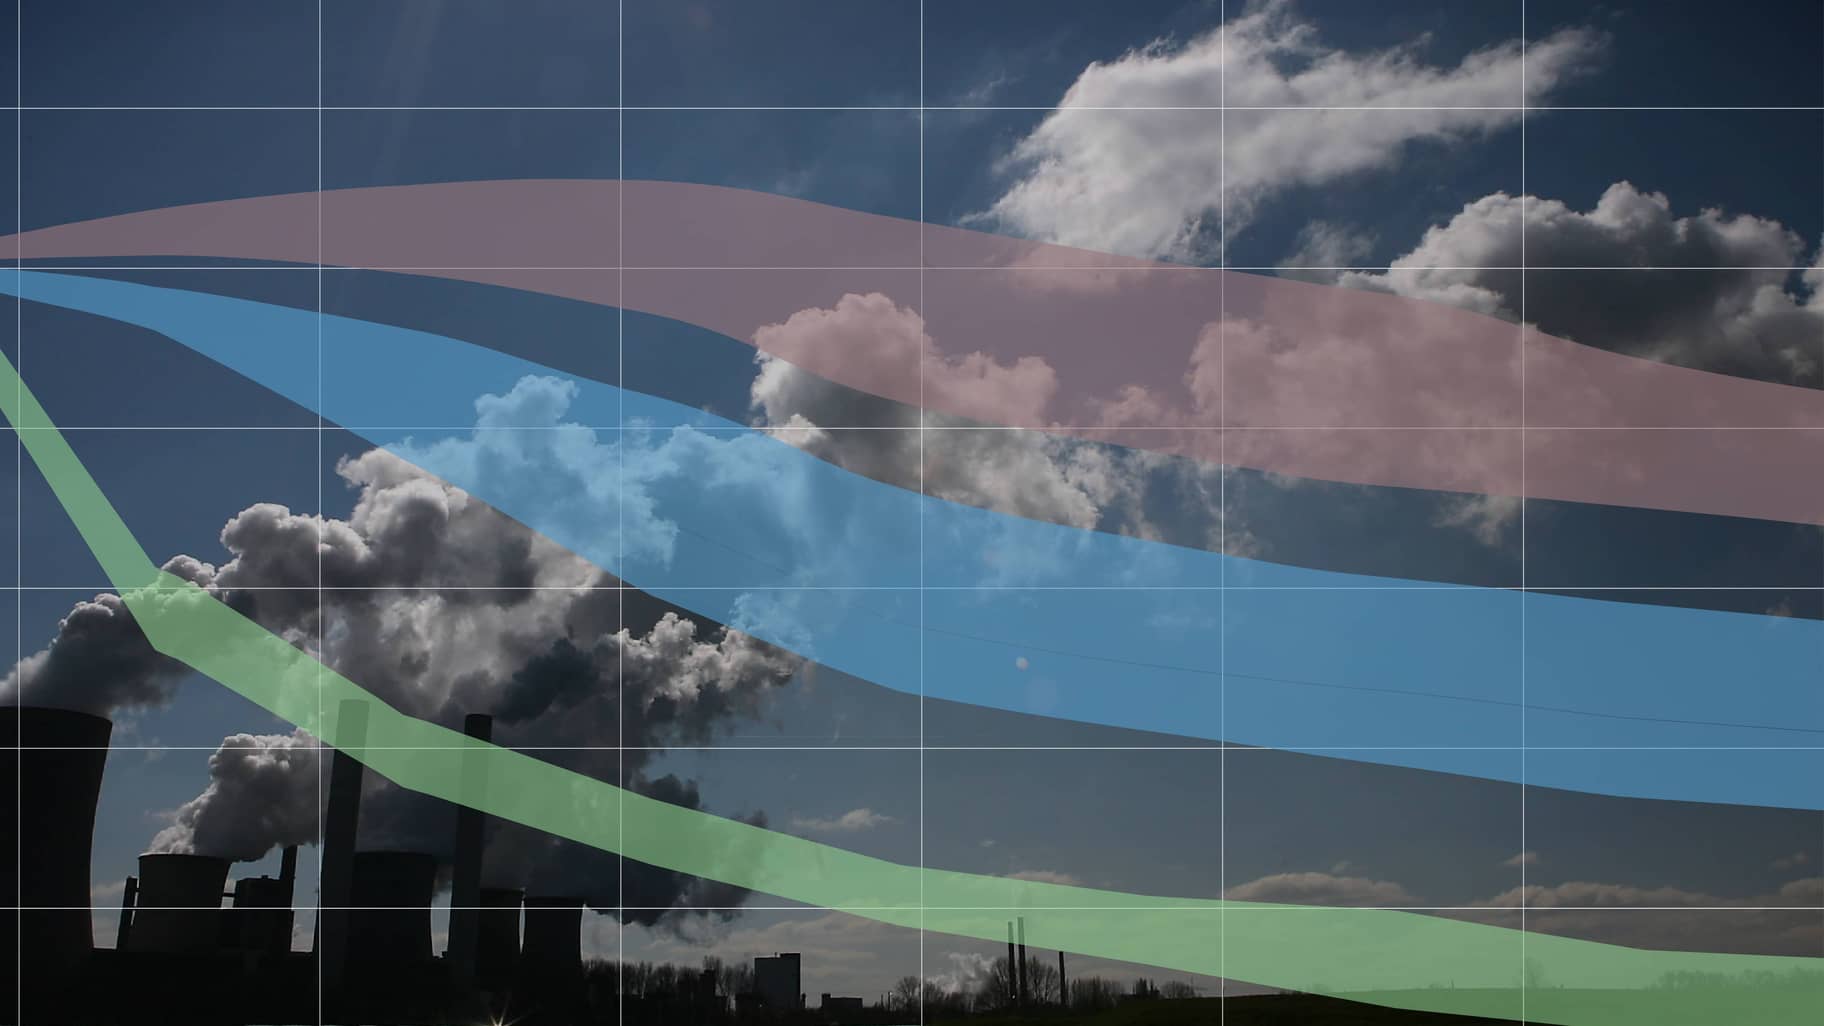
Depending on how much greenhouse gas mankind will still emit, the models arrive at different results: The most likely path currently corresponds roughly to a scenario developed by the Intergovernmental Panel on Climate Change called RCP4.5, according to which the Earth would warm by about 2.5 to 3 degrees Celsius by 2100 compared to the pre-industrial era. We refer to this scenario here as "moderate climate change mitigation."
Average temperatures can be calculated quite well, but rare extreme weather events are more complicated. To better estimate the consequences of heavy rain or heat, scientists therefore often use the more extreme scenario RCP8.5, which assumes more severe global warming with poor climate protection. The difference between the two scenarios is rather small until the middle of the century.
At the 2015 World Climate Conference in Paris, a very large number of countries pledged to limit global warming to well below two degrees. To really achieve this goal, truly effective climate protection would be needed, and emissions would have to be reduced very quickly. The Intergovernmental Panel on Climate Change has named this scenario RCP2.6.
Which sources do we use?
Der Deutsche Wetterdienst (DWD) und das Helmholtz-Klimaforschungszentrum Gerics stellen auf ihren Seiten ausführliche Beschreibungen ihrer Klimamodelle bereit. Die historischen und zukünftigen Werte für Heiße Tage, Tropische Nächte und den Waldbrandindex in diesem Stück sind vom DWD. Für die Mitte des Jahrhunderts sind Mittelwerte für den Zeitraum zwischen 2041 und 2070 dargestellt, der Zeitraum Ende des Jahrhunderts ist 2071 bis 2100. Der historische Vergleichswert zeigt den Mittelwert der Jahre 1971 bis 2000.
Die Daten für Niederschlag, Starkregen, Trockentage, die maximale Dauer von Hitzeperioden, Frosttage und die Durchschnittstemperatur stammen von Gerics. Der historische Vergleichszeitraum ist auch hier 1971 bis 2000, der Wert für die Mitte des Jahrhunderts 2036 bis 2065 und Ende des Jahrhunderts 2069 bis 2098.
We have calculated the current values ourselves from DWD data. The basis in each case is grid data for the years 1991 to 2020 or, in the case of the maximum duration of hot spells, 1986 to 2015, since more recent data is not yet available here.
What does the median mean and why is there a light-colored area in the graphs?
The scientists have calculated not just one, but several different models for each climate protection scenario. These models each produce a slightly different projection for the future. A median is formed from all the results, representing the most probable climate future. The area with a light background in the graph shows the range in which the results of all models lie. There is a special feature for the hot days, tropical nights and the forest fire index: Here, the models with the most extreme values upwards and downwards are not shown.
For which regions do the values apply?
An individual climate outlook is available for each of the 401 counties and independent cities. For areas of less than 400 square kilometers, the county or city is combined with all adjacent counties and cities to form a region. We always show the averaged value of a region.
What does "special change" mean?
In the interactive tool, a climate characteristic value for a selected region is marked as a value with "special change" if the region belongs to the 60 most changing regions in Germany both in the middle and at the end of the century (0.85-quantile of the medians in each case).
All data for download
You can download the data set we compiled here. Please make sure to cite the DWD, Gerics and the Süddeutsche Zeitung as sources when using the data.